
https://weighteddown.stayupfront.com/changelog/history-chart-bmi-gradients
History chart BMI gradients
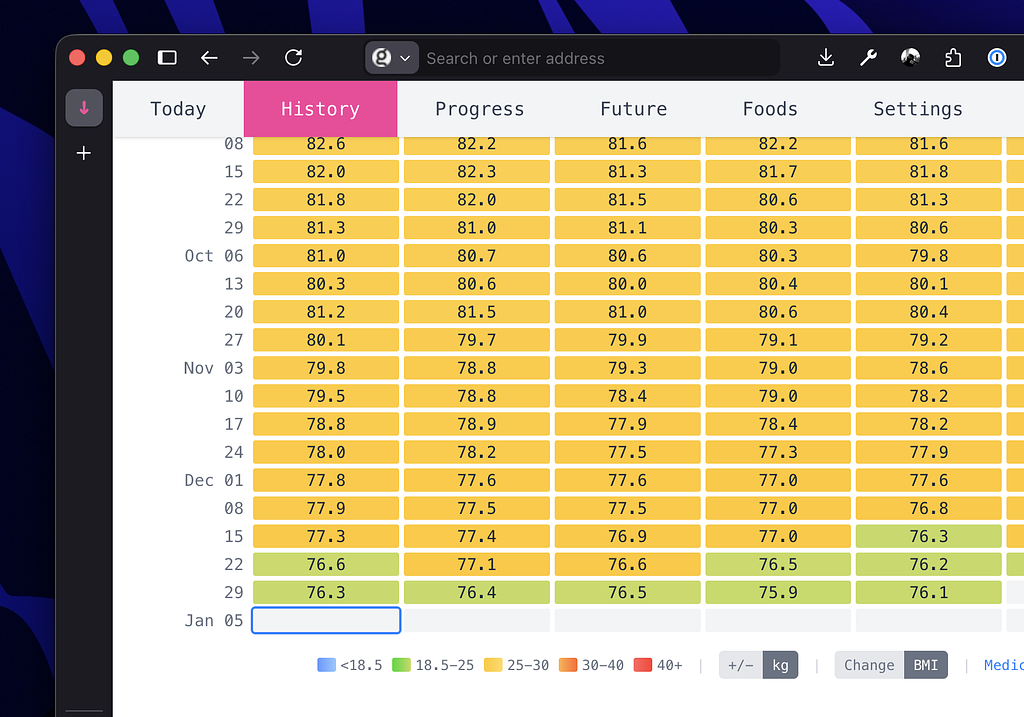
If you have you height entered in settings, the history graph now lets you choose BMI to display as the color option. Not so useful on a day-by-day basis, but when you have many months of data it can be a nice way of visualising your progress.